How could it be otherwise in a program focused on this type of work, the modes of operation with numerical data that we can carry out in Excel are almost infinite. All this thanks to the functions and formulas that it presents us by default. To give you an idea, in these lines we are going to talk about how to calculate a range in the Microsoft program.
In this case we are referring to an application that is part of the firm’s office suite, Office, and that will be extremely useful when creating our own spreadsheets. These can be as large as we want and contain all the data we need. All this is divided into the enormous number of individual and independent cells that the main interface of the program offers us. In this case, as we mentioned before, we are going to focus on a fairly common statistical operation that the Excel calculation program tries to facilitate.
Specifically, we are going to talk about the easiest way to calculate a statistical range in the Microsoft program. For those of you who don’t know, in statistics a range is the interval that is calculated between the maximum and the minimum value within a series of data. Obviously, these data to which we refer are the numbers that we manually enter in Excel to carry out the operation. Therefore, we can say that this range serves to give us an idea of the separation or dispersion existing in that set.
To achieve all this, what we are going to have to do is subtract the minimum value from the maximum once we have both values. Therefore, at first, what we must do is open the program as such, enter all the numerical data with which we are going to operate in this case.
Calculate the range of data in an Excel sheet
For example, we can add these to column A of the main interface of the spreadsheet program. Once we have all these numbers in the table, we are going to calculate the maximum value of the entire range that we are working with. To do this, we use the following formula:
=MAX(A1:A10)
We must take into account that the cells occupied with the data with which we want to work are between A1 and A10 in this specific case. So, next, what we will do is calculate the minimum value of that same set through this formula:
=MIN(A1:A10)
In this way we will already have the maximum value and the minimum value of the entire set of numbers with which we are dealing with the two independent cells of Excel. Now we only have to calculate the statistical range that corresponds to all these numerical data. This means we only have to subtract the value obtained from the cell with the maximum number, from the minimum value. To achieve this, we only have to use the formula that we expose here:
=C4-C5
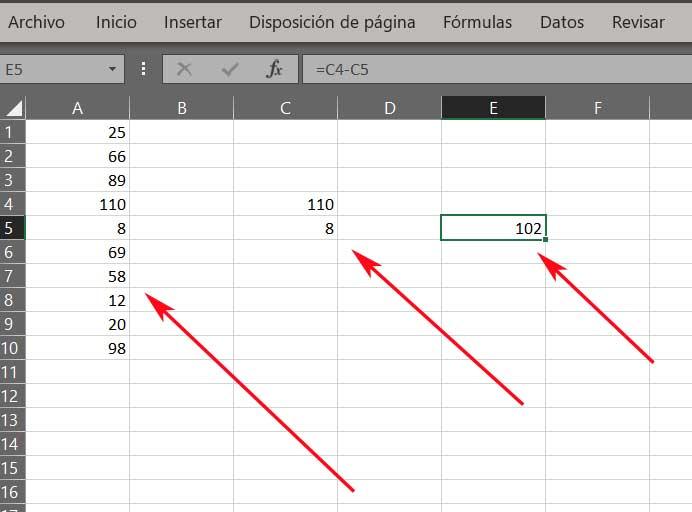
At this point we must take into consideration that cell C4 contains the maximum value of the data set and C5 the minimum. In this way we will obtain the statistical range, which is what we are looking for in these lines.


